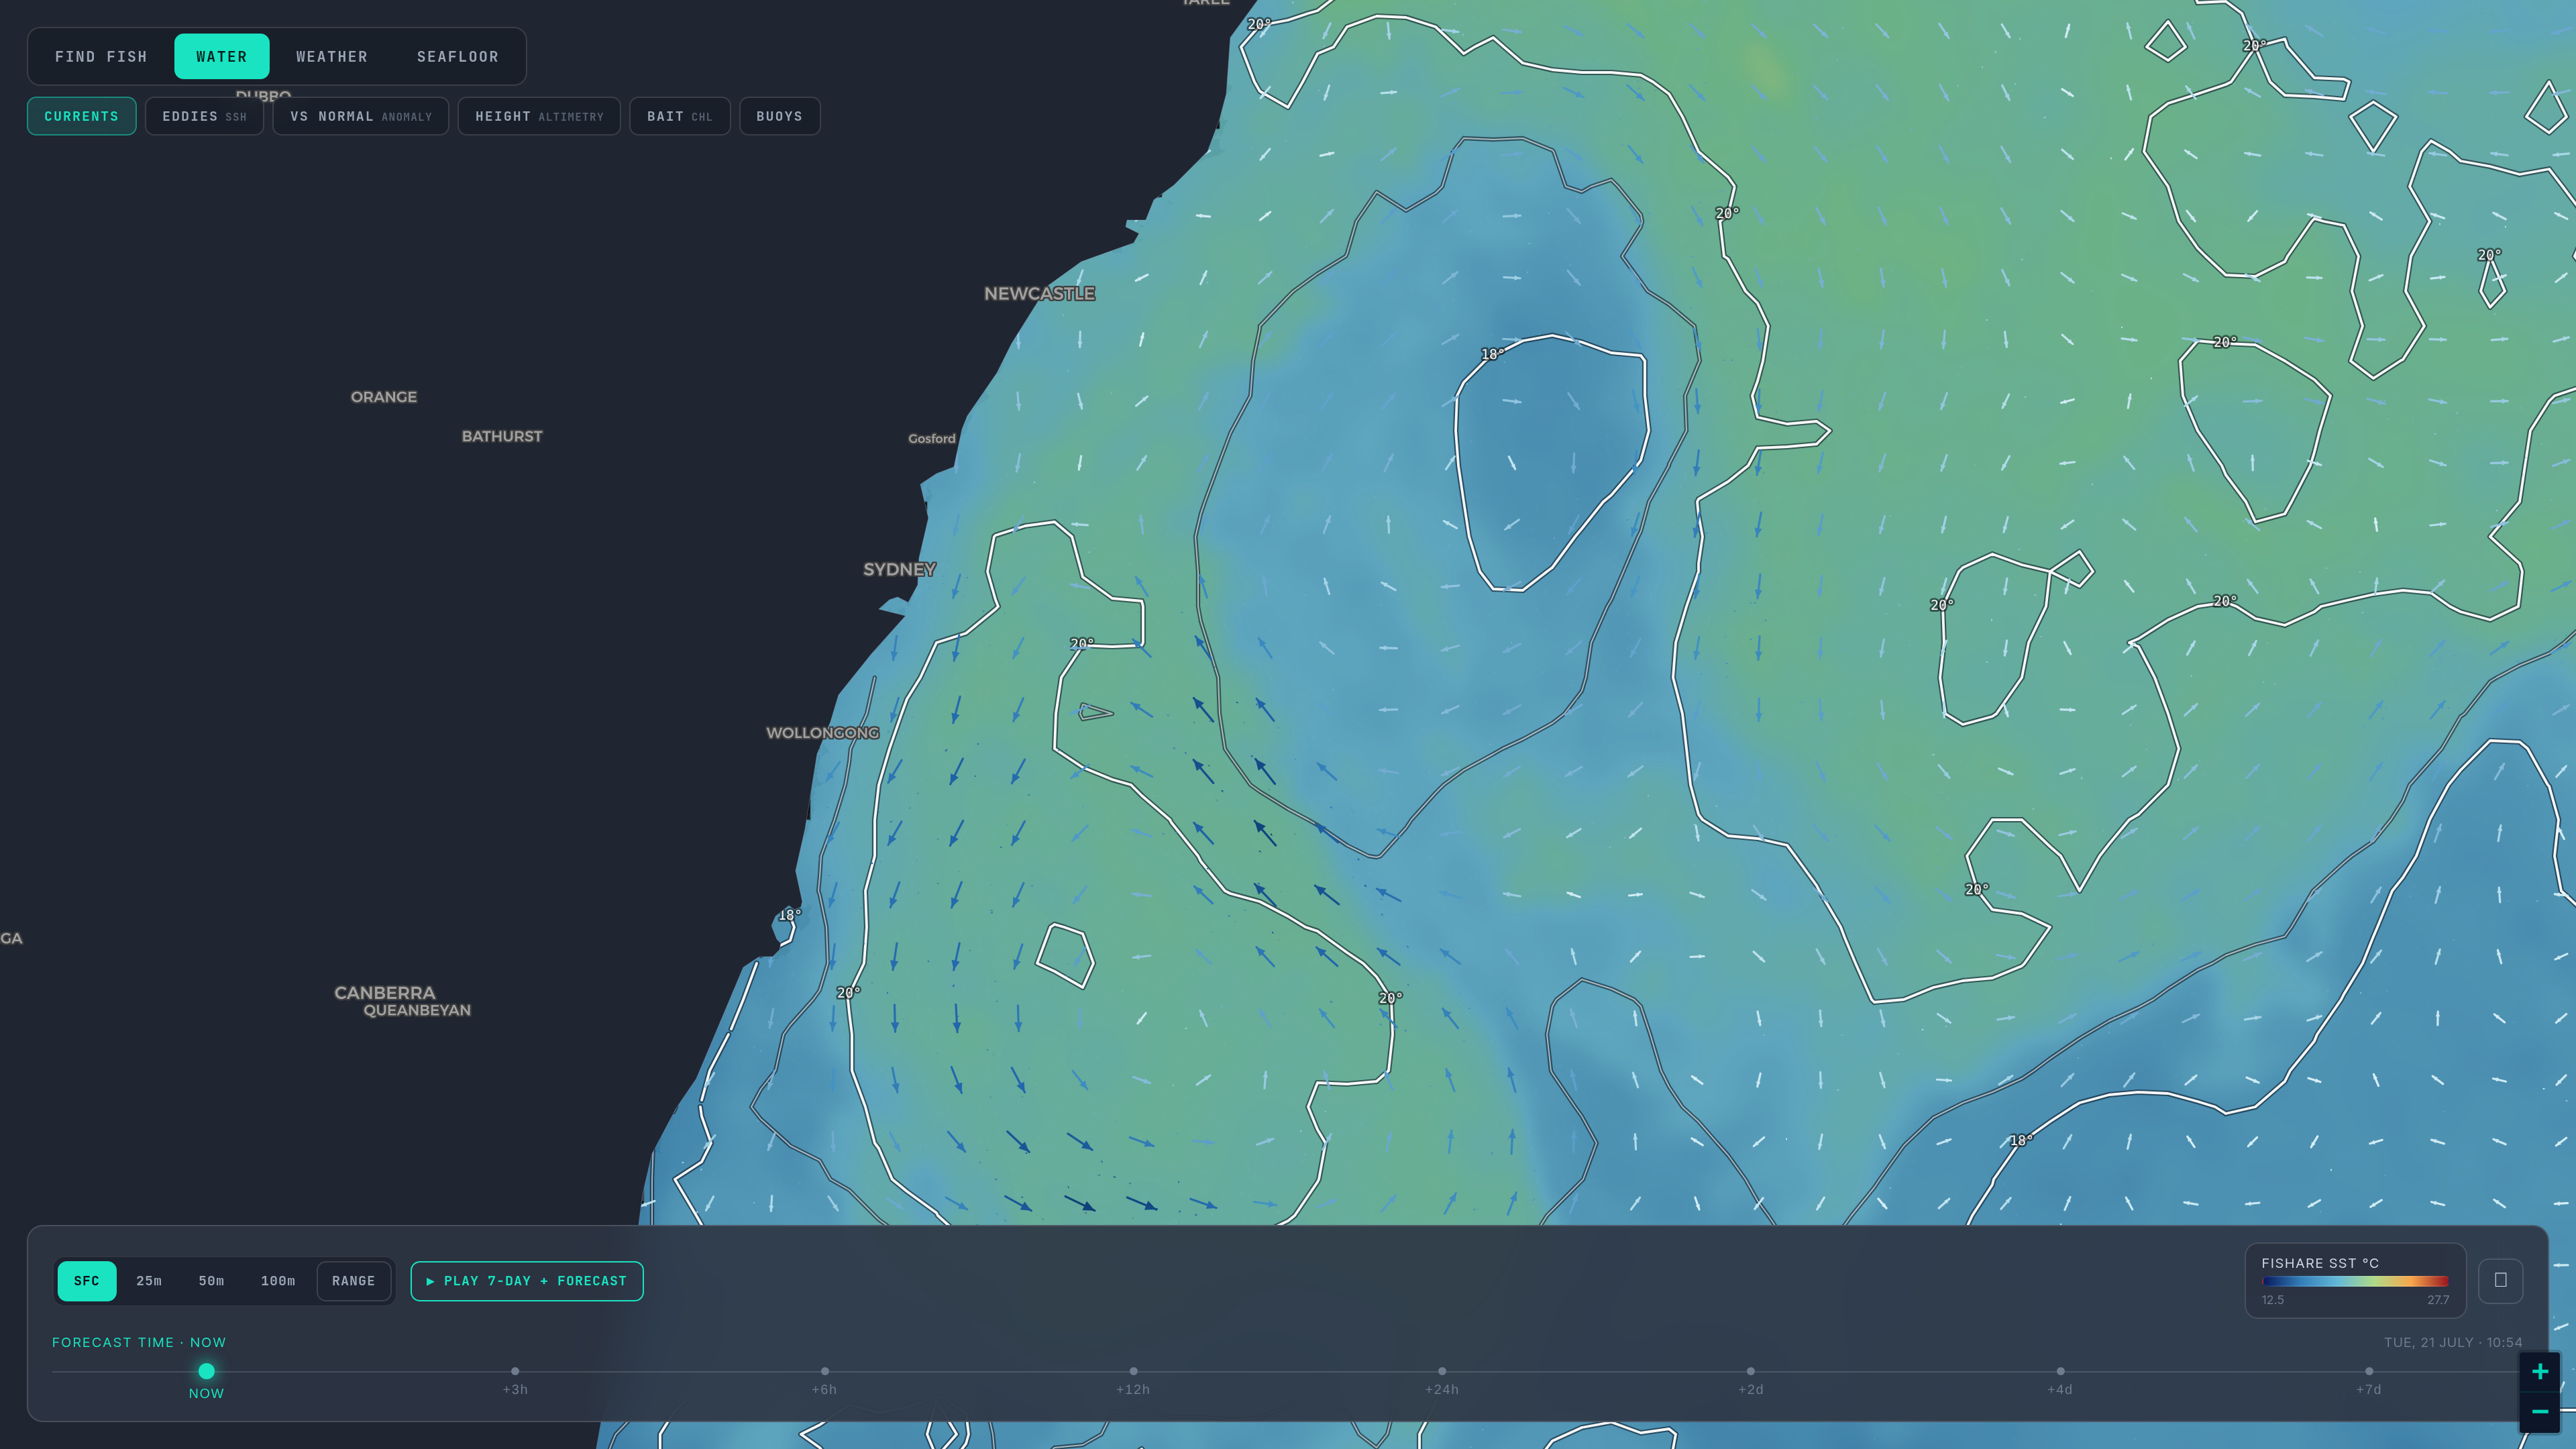
We respect what RipCharts does well. Here is exactly where we're different and where we're not.
RipCharts is for the expert who wants the raw ocean data at maximum update frequency and the tools to read it by hand — and who will pay US$169/yr per region for the Premium tier that carries it. Fishare renders the daily field with the interpretation already on the map — isotherms, break chips, eddy structure, a real temperature readout — plus playback and a 2-day forecast, inside a full free forecast app, for US$49.99/yr across every covered region. If reading subsurface SST and altimetry by hand is your edge, keep RipCharts. If you would rather open one app the night before and see the break already highlighted, and where it is heading tomorrow, that is us.
RipCharts ships the deepest raw satellite-imagery stack in offshore fishing, sold per region at US$99/yr Standard or US$169/yr Premium, single-user, and expects you to read it. Fishare renders its own daily SST field with the isotherms, breaks and eddies already drawn — plus a 7-day playback of past fields their product does not list — inside a full free forecast app, for US$49.99/yr across every covered region.
RipCharts is a pro instrument: raw and composite SST, cloud-free mashups, sub-surface SST (Premium), altimetry, salinity and up to 20 SST updates a day — each update a raw polar-orbiter pass, partial and cloud-holed, which is why the composites exist — with fine-grained temperature-range tuning so an experienced canyon angler can tease out a half-degree break. That depth is real and we do not pretend to match it — and it is sold one region at a time, single-user — US$169/yr each on Premium, or US$99/yr on a Standard tier that drops the mobile apps and the sub-surface layer. What changed is that Fishare no longer just uses SST as a hidden model input: it renders its own daily SST field, with isotherms, automatic break detection and a real temperature readout at the tap point, EAC eddies with the surrounding sea-surface-height structure, and 7-day playback plus a 2-day forecast on the same field. RipCharts gives you the raw data and a very good knife. Fishare draws the field with the reading already started — and adds a per-species HSI score on top — inside a forecast app you were probably already using.
A factual head-to-head across the features that matter for the fishing-decision use case.
| Feature | RipCharts | Fishare |
|---|---|---|
| Raw / composite SST imagery | Yes — raw scans, composites, cloud-free; 8–20 SST updates a day on Premium (4–8 on Standard) | Daily gap-filled (cloud-free) L4 SST at ~4 km, rendered as our own field |
| Sub-surface temp (0/-25/-50/-100 m) | Yes — Premium tier only; model-derived (HYCOM-class). Depth ladder not published on their registration page (unverified — retained from 2026-07-16) | Yes — SFC/25/50/100 m ladder, same model class (nobody senses subsurface from a satellite) |
| SST update frequency | 8–20 ×/day on Premium, 4–8 on Standard — but each update is a polar-orbiter pass: a partial swath with cloud holes. Their own cloud-free composites exist because raw passes are incomplete. | One complete, gap-filled field daily — plus a 2-day forecast of the same field |
| Playback of past fields | Not listed — their registration page sells a 5-day SST forecast, but no replay of past fields | Yes — 7-day playback, plus a 2-day forecast, on the same field |
| Isotherms / contour lines | Yes — you tune the ranges | Yes — automatic, 1°C steps (0.5°C on tight-range days) |
| Break / edge highlighting | You read the colour field yourself | Automatic — gradient detection with °C-delta chips on the strongest fronts |
| Temperature readout at a point | You estimate from the colour scale | Tap/hover reads the actual grid value in °C — not a hue-guess |
| Currents + EAC eddy structure | Yes | Yes — vectors + SSH contour loops + warm/cold-core eddy badges (AU east + NZ only) |
| Chlorophyll-a | Yes | Yes — its own layer |
| Altimetry (SSH) layer | Yes | Yes — labelled SSH contours in cm (AU east + NZ) |
| True-colour satellite imagery | Yes, 1-2 updates daily | Yes — NASA VIIRS 250 m, daily, free |
| Salinity layer | Yes | No |
| Per-species habitat model | No — you read the raw data | Yes — HSI scores SST + front + shelf-break per species everywhere it runs; the eddy term adds where eddies are baked (AU east + NZ) |
| Per-species bite score | No | Yes — multi-input model, 200+ species profiled |
| Full forecast app (wind/swell/tide/AIS) | No — imagery focus | Yes — one canvas, 14-day slider |
| Coverage | Sold per region — 16 regions: US Gulf/East/West, Hawaii, MX Baja, 9 × AU, 2 × NZ | SST, chlorophyll and subsurface across AU east, NZ, US East + Gulf, UK and Japan — one price. Currents, eddies and SSH are AU east + NZ only |
| Free tier | None — annual sub to see data | Forever-free forecast; SST + HSI is the paid layer |
| Price | US$99/yr (Standard) or US$169/yr (Premium) per region, single-user, annual only | US$5.99/mo · US$49.99/yr — all layers, all covered waters |
RipCharts's pricing structure against Fishare's. The forecast app is free; the ocean-intelligence layers (SST, HSI and friends) are the single paid tier.
Pricing verified 2026-07-31 against RipCharts’ own registration page (ripcharts.com/RegisterForPremium.aspx): two tiers, both sold per region and annual-only — Standard at US$99/yr and Premium at US$169/yr, each priced identically across all 16 regions they list. The licence is single-user and the term is 12 months, with payment taken up front and no free look at the data. An angler who fishes more than one stretch of coast buys a separate subscription for each region on either tier. Premium is the like-for-like tier against Fishare’s SST + HSI layer, because Standard has no mobile app and no sub-surface SST.
Live since July 2026. Users who signed up before the paid flip keep the layers free for life (founding members).
RipCharts is sold one region at a time — tick the stretches of coast you actually fish. Fishare is one price across every covered region, so its side of the sum never changes.
The four AU east-coast regions from RipCharts’ own registration page (verified 2026-07-31). They list 16 regions in total — the US coasts, Hawaii, Baja, the rest of Australia and both New Zealand islands — all on the same per-region terms. The sum below uses their Premium price.
RipCharts’ licence is single-user — each crew member who wants the charts on their own phone needs their own subscription. A Fishare account works the same way, so both sides scale with crew.
RipCharts Premium pricing from their registration page, 2026-07-31 — their cheaper Standard tier is US$99/yr per region and drops the mobile apps and sub-surface SST. Verify current pricing before subscribing. Fishare price per docs: US$5.99/mo or US$49.99/yr.
Limitations of RipCharts that come up in our own use and in public reviews. We don't list these to attack the product — they're context for the routing below.
RipCharts shows a 24.1°C break tightening against the 100-fathom line. Whether that is a yellowfin edge today — and how the shelf-break slope and the nearest warm-core eddy change that — is on you. The synthesis, the actual fishing decision, is manual.
It is satellite imagery, full stop. There is no per-species suitability and no catch-trained scoring. Two anglers reading the same RipCharts map can reach opposite conclusions; the model is in their heads.
US$169/yr buys one Premium region for one user — no monthly option and no free look at the data. Fish the QLD and NSW coast and you are buying several regional subscriptions (roughly US$676/yr for the four east-coast regions), and the licence is single-user, so a second crew member needs their own.
Use-case routing — diplomatic, not flippant. Each row names a specific angler profile and the better tool for that profile.
Sub-surface SST, altimetry and up to 20 SST passes a day are the entire edge for that workflow.
That is a model output, not a raw-imagery read — the HSI does the synthesis RipCharts leaves to you.
RipCharts is imagery only; Fishare is one canvas for the whole trip.
One US$49.99/yr sub covers every layer across all covered waters, against US$169/yr per Premium region single-user on RipCharts — several subscriptions to cover the same coast.
RipCharts and Fishare sit at opposite ends of the same shelf: RipCharts maximises raw-data depth and hands interpretation to the expert; Fishare maximises synthesis and hands the angler an answer. A serious canyon crew could legitimately run both — RipCharts for the raw subsurface read, Fishare for the modelled per-species score and the rest of the forecast.
No clean migration — different jobs. If you have the experience to read raw subsurface SST and altimetry, RipCharts is a sharper instrument than our single daily HSI layer. If you would rather not, the HSI is the model doing that work for you.
Pricing and tier features re-verified 2026-07-31 against RipCharts’ own registration page, ripcharts.com/RegisterForPremium.aspx (Standard US$99/yr and Premium US$169/yr, both per region across the 16 regions they list, single-user, 12-month term, no free look). Comparison otherwise verified 2026-07-16 against the RipCharts App Store listing and ripcharts.com, cross-checked against Fishare’s shipped SST feature set (docs/sst/ripcharts-parity-spec.md). Feature depth on the RipCharts side is assessed from their published dataset list; we credit their raw-imagery depth and update-frequency advantage explicitly rather than claim parity there.
The forecast side is free forever — live map, bite score, 7-day forecast and spot pages, no account needed to browse. The ocean-intelligence layers (SST with isotherms and break detection, HSI habitat heatmap, chlorophyll, subsurface temperatures, altimetry) are the single paid tier: US$5.99/mo or US$49.99/yr across every covered region, with a free look over a window of your own local water.
RipCharts is for the expert who wants the raw ocean data at maximum update frequency and the tools to read it by hand — and who will pay US$169/yr per region for the Premium tier that carries it. Fishare renders the daily field with the interpretation already on the map — isotherms, break chips, eddy structure, a real temperature readout — plus playback and a 2-day forecast, inside a full free forecast app, for US$49.99/yr across every covered region. If reading subsurface SST and altimetry by hand is your edge, keep RipCharts. If you would rather open one app the night before and see the break already highlighted, and where it is heading tomorrow, that is us.
A multi-input neural network scored per species, per hour — not a Solunar lookup. Inputs include wind, swell, tide stage, barometric pressure and trend, where the warm-cold water edges are, what the current is doing, moon phase, and a couple of dozen other features per hour. It is decision support built from live conditions, not a guarantee — we publish no accuracy figure, and some days the score is high and the water is dead.
Yes — the native iOS app is on the App Store (search is still indexing; the direct link is apps.apple.com/app/fishare/id6783726939), and it is free for everyone: there is no paid-tier gate on the app itself. A native Android app is on its way to Google Play. Until it lands, Fishare runs on Android as a Progressive Web App: open fishare.app in Chrome, then 'Add to Home Screen' — offline support and push notifications included.
July 2026. We re-verify pricing, feature parity and known limitations each time a major version of RipCharts ships or pricing tiers change. The reviewed date at the top of the page is the source of truth.
They reflect the version of RipCharts we checked at the last review date. Software changes; if you spot something that no longer matches the live product, let us know via the feedback link in the app and we'll update.
Two tiers, both per region and annual-only: Standard at US$99 per year and Premium at US$169 per year, on a single-user licence — verified against RipCharts’ own registration page (ripcharts.com/RegisterForPremium.aspx) on 31 July 2026. Standard is web-only — their comparison table marks both Android and iOS with a red X on that tier — and leaves out sub-surface SST, the 5-day SST forecast and salinity, so Premium is the tier that compares to Fishare. Each stretch of coast (for example Queensland/Cairns, Queensland/Mackay, Brisbane and Sydney) is a separate subscription, with no free look at the data: covering the Queensland–NSW east coast means four Premium subscriptions, roughly US$676/yr. Fishare’s SST + HSI layer is US$5.99/mo or US$49.99/yr across every covered region.
Fishare renders its own daily SST field — gap-filled (cloud-free) satellite data with isotherm contour lines, automatic temperature-break detection and a real tap-to-read temperature — rather than raw satellite passes. It also plays back 7 days and forward through a 2-day forecast on the same field, which static composites cannot do. RipCharts publishes the raw imagery itself, updated 4–12 times a day, with subsurface temperature at four depths; if reading raw passes by hand is your workflow, RipCharts is the deeper instrument.
Fishare’s rendered grid is roughly 4 km (0.04°) for AU coverage, built from NASA’s 1 km MUR satellite product with gap-filling for cloud cover — we don’t claim 1 km resolution ourselves, and we don’t match RipCharts’ raw-imagery resolution or update cadence. The trade-off is interpretation: Fishare’s field arrives with the isotherms, break chips and a real temperature readout already applied, updated daily, with playback and a 2-day forecast.
Fishare tracks your home spots and pings you when the next 3-hour peak window opens. Log catches and blanks to teach the model your local patterns. The forecast, saved spots and catch log stay free, forever.
Open Fishare